[Column] Ryoji Ikeda|Acoustic art of "space = visualization" drawn by ultra-high frequencies and data sound
Column en Experimental Installation Minimal![[Column] Ryoji Ikeda|Acoustic art of](/../assets/images/column-ryoji-ikeda.webp)
Sound as data, space as sound
Text: mmr|Theme: Extreme minimalism that converts data into sound and light and allows us to perceive the space itself
When discussing Ryoji Ikeda’s work, the first thing to understand is that the framework of ““music’’ itself is not his main subject. His creations are close to comprehensive perceptual devices that integrate acoustics, mathematics, physics, programming, and visual expression.
What is particularly distinctive is the use of ultra-high frequencies that approach the limits of human hearing. This is not just a stimulus, but a design that exposes the boundaries between “hearing” and “not hearing.” In other words, it presents the ““conditions of perception’’ rather than the sound itself.
His sounds are broken down to their smallest units: clicks, noises, and sine waves. They function not as rhythms or melodies, but as particles for measuring time and space. What is important here is that sound is treated as a “structure” rather than a “meaning.”
And this structure is perfectly synchronized with vision. The numbers, barcodes, and grids shown on the projection are generated from the same data as the sound. As a result, the audience is placed in a state of ““seeing sound” and ““hearing light.”
Sound no longer exists only for the ear, but becomes a structure that is perceived throughout space.
From minimal to data: initial activities and turning points
Ikeda”s career dates back to the 1990s. Their extremely stripped-down sound attracted attention in the Kyoto-based club/experimental music scene. His approach has always focused on the “physicality of sound’, although particularly connected to minimal techno and click music trends.
Around 1995, the foundation for a body of work that would later receive international acclaim was formed. The 1998 album “”+/-‘’ revealed a style that treated digital signals themselves as sound.
An important change during this period was the expansion from “musical works” to “installations.” Rather than simply producing sound sources, he is moving toward turning the entire space into a work of art.
In the early 2000s, we began collaborating with IRCAM (Institute of Acoustics and Music) in Paris. Here, he collaborates with scientists to conduct research into sonifying data and physical phenomena. This experience culminated in his later masterpiece ““datamatics’’ series.
Ikeda’s turning point was the moment it redefined sound from a raw material to a form of information expression.
datamatics: Visualizing the universe of data
Ikeda’s masterpiece, ““datamatics,’’ is a project that converts vast amounts of scientific data into sound and video. The data used is wide-ranging, including astrophysics, DNA sequences, and particle information.
The core of this series is to transform “data that is too abstract to understand” into a form that can be experienced sensually.
Below is a conceptual diagram of the basic structure in datamatics.
What is important here is that sound and video are not independent, but are generated from the same data. In other words, vision and hearing are just different aspects of the same phenomenon.
Additionally, the “scale” of his works changes frequently. By treating everything from the micro (elementary particles) to the macro (the universe) with the same logic, the audience is made to relativize their own position.
Data is not abstracted but converted into “reality” experienced through perception
Ultra-high frequencies and the body: exposing the limits of perception
In Ikeda’s work, ultra-high frequencies are more than just a sound effect. It functions as a device to measure the body itself.
The human audible range is generally considered to be between 20Hz and 20kHz, but Ikeda actively uses the range near or beyond that upper limit. At this time, the sound is felt as ““pressure” or ““vibration” rather than ““heard.’’
Below is a conceptual diagram showing the relationship between the audible range and Ikeda’s works.
This approach makes the audience aware of how far their own bodies can accept sound. In other words, ““one’s own sense organs’’ are incorporated as part of the work.
Additionally, because sound reflection and interference change depending on the venue, the experience will be different each time even with the same work. Here, space is not just a container, but an active element.
Ikeda’s sound is not something that is heard with the ears, but a phenomenon that is measured throughout the body.
The idea that space = data visualization
If Ikeda’s work could be summed up in one word, it would be “transformation of space into data.” He uses sound and light to present the space itself numerically and structurally.
Usually, space is treated as a background that exists unconsciously. However, Ikeda “visualizes” all elements such as sound reflection, distance, density, and time difference.
For example, the following structure will be formed in the installation.
Through this process, the audience gains the experience of ““listening to the space.’’ In other words, rather than sound describing space, space itself appears as sound.
Additionally, his works often use extreme contrasts (silence and loud noises, darkness and flashes of light). This is a method to emphasize the threshold of perception and highlight the existence of space.
Space is transformed from a background to an object that can be read as data.
roger that. Add a representative works section in a way that fits naturally into this column structure. This is a complete manuscript that can be inserted as is according to the existing tone.
Embodiment of “data = space” seen in representative works
test pattern: information as the smallest unit
test pattern is one of the series that presents Ikeda’s philosophy in its purest form. Barcode-like black and white stripes, rapidly changing frames, and synchronized click sounds.
What we are dealing with here is not text or images, but ““data itself.’’ Character strings, numbers, and image data are all reduced to binary numbers and converted directly into sound and video.
Its characteristics are its speed and density. As information flows at a speed that exceeds the limits of what humans can perceive, it becomes impossible to ““understand’’ it.
On the contrary, however, its excess makes the data emerge as a “pure structure.”
Information loses its meaning and appears as a structure
datamatics: Sensitizing scientific data
datamatics is Ikeda’s masterpiece and the project where his methodology is most systematized.
The data used includes CERN particle experiments, the human genome, and space observation data. This information, which is normally only available to experts, is reconstructed as sound and light.
Countless points, lines, and grids appear in the video, and they are transformed and rearranged at high speed. At the same time, clicks and noises are precisely synchronized.
The important point here is that it is not a “translation” but a “conversion.” Instead of explaining the meaning of the data, let us perceive its structure as it is.
The audience experiences the scale of the data by being “overwhelmed” rather than understanding it.
Incomprehensible data becomes reality through the senses
spectra: sculpting light itself
spectra is a work that focuses on light rather than sound. Countless powerful searchlights shot vertically into the sky, forming a huge pillar of light.
In this piece, sound is kept to a minimum and the visual scale comes to the fore. But its structure is still data-like.
The placement, spacing, and intensity of light are all calculated, and the urban space and natural environment themselves become part of the work.
The audience can see this light from a distance, extending the work beyond a single venue.
The space itself becomes a canvas, and light is arranged as data.
superposition: multilayer structure of perception
superposition is a live performance piece based on quantum mechanical concepts.
Images projected on multiple screens, synchronized sound, and time axes. When they overlap, the feeling of ““multiple states existing at the same time’’ is created.
In this work, the audience cannot be fixed on one point of view. The experience changes depending on where you look and where you listen.
Reality is not perceived as a single layer, but as an overlapping of multiple layers.
Consistent thought seen in representative works
What these works have in common is a thorough attitude of ““presenting the data as is.’’
・Eliminate meaning
- Break down into the smallest units ・Expand throughout the space
Ikeda’s work is created through these three processes.
What is important is that these are not just concepts, but are realized through extremely precise design. Sound, light, space, and time are all synchronized and integrated into one perceptual experience.
All of Ikeda’s masterpieces function as devices for “feeling” data.
Chronology: Ryoji Ikeda’s main activities
Ikeda’s journey is also a history of expansion from a musician to a space designer.
Conclusion: The art of reprogramming perception
Ryoji Ikeda’s works go beyond mere music and images and are an attempt to redefine human perception itself. He transforms the most abstract entity of data into the most physical experience.
As a result, the audience is forced to fundamentally reconsider the acts of ““watching” and ““listening.” Sound becomes space, space becomes data, and data is returned to sensation.
This cycle is at the heart of Ikeda’s art.
Ikeda’s work presents new sensory protocols for understanding the world
Explore more like this
![[Column] When sine waves change the space—Sachiko M and the aesthetics of extreme minimalism](/../assets/images/column-sachiko-m.webp)
[Column] When sine waves change the space—Sachiko M and the aesthetics of extreme minimalism
Prologue: Begins where the sound is about to disappear
![[Column] Pan Sonic - Extreme acoustic minimalism: Finland's black current that redefined electronic music](/../assets/images/column-pan-sonic.webp)
[Column] Pan Sonic - Extreme acoustic minimalism: Finland's black current that redefined electronic music
Prologue: “Black electrons” emitted from the silence of the north
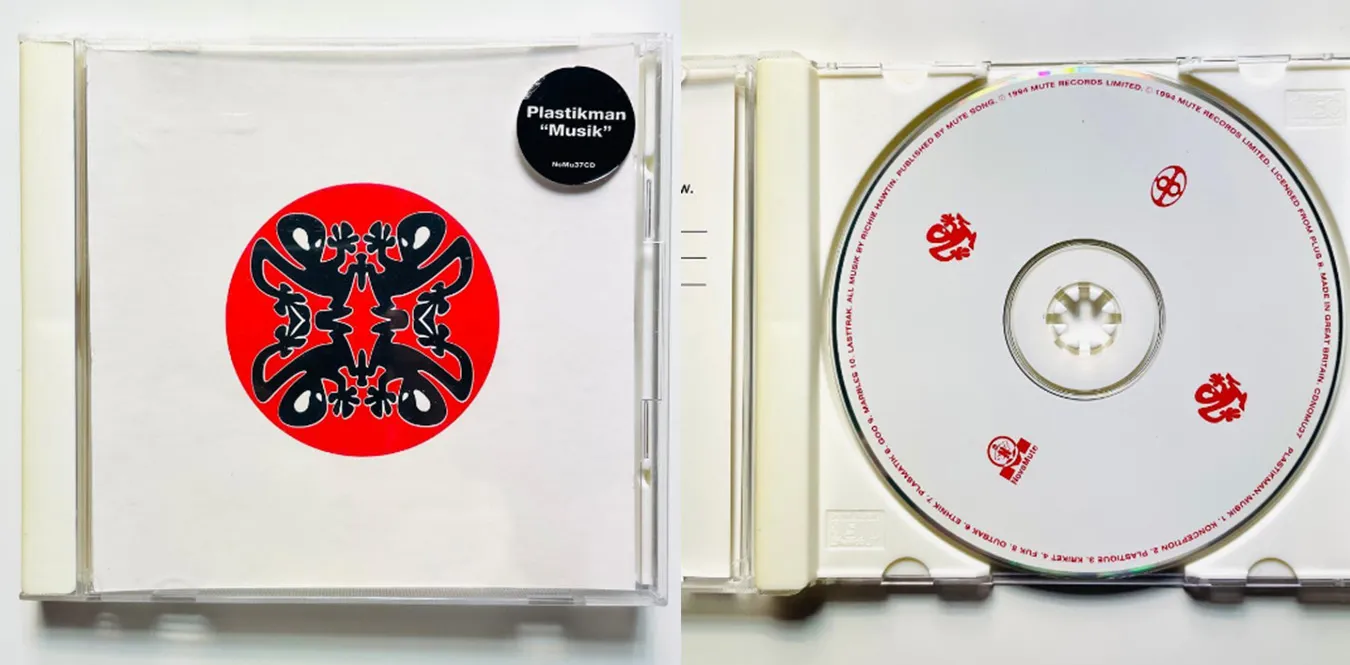
Plastikman – Musik
An album released by Richie Hawtin under the alias Plastikman on the NovaMute label in 1994. This is Richie Hawtin’s third studio album and second under his Plastikman name.
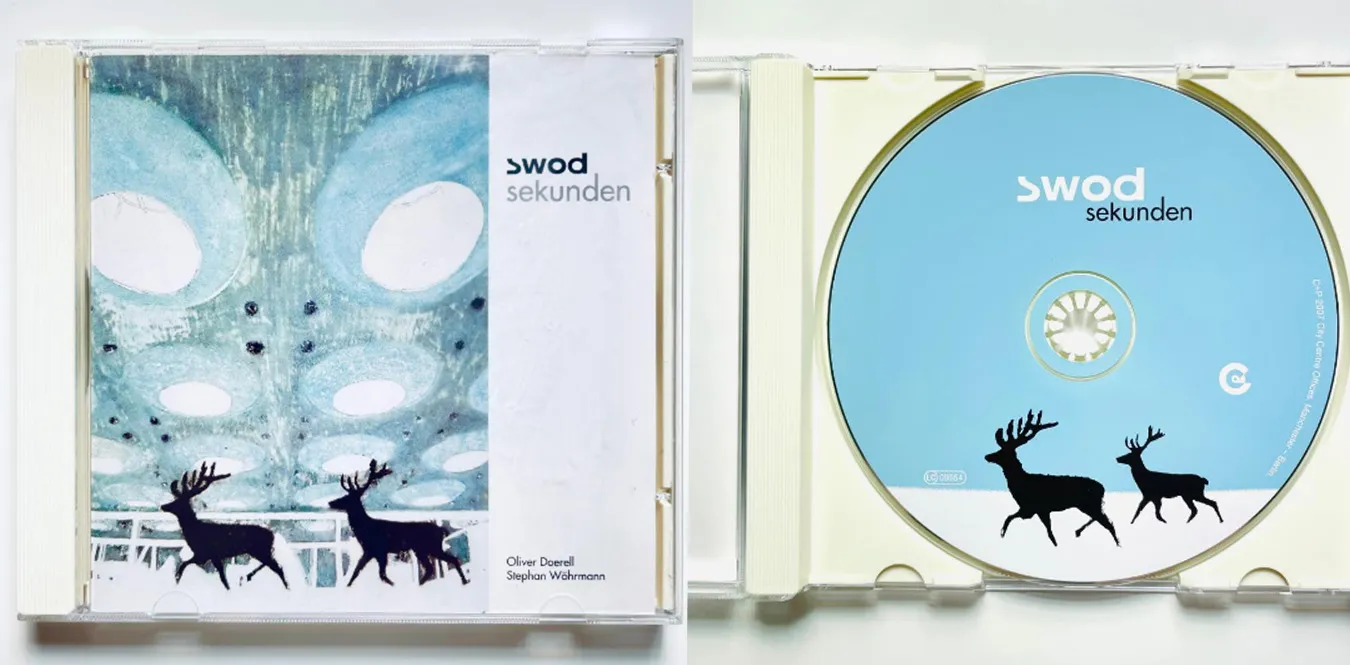
Swod – Sekunden
Swod is a recording project by musicians Oliver Doerell and Stephan Wöhrmann.